Interactive Map Help
- Navigating around the Map
- Changing the Map Scale
- Using The Table of Contents (ToC)
- Searching the Map
- Map Tools
- Using the Drawing Tools
- Searching the Map Layers (Search for a feature)
- Searching for a Dataset
- Using the Site Check Tool
- Using the Clear Selected Feature Tool
- Using the Identify Feature Tool
- Using the Where Am I Tool
- Using the Measure Tool
- Using the Print Tool
- Using the Bookmark Map Tool
- Using the Load User Data Tool
- Using the Data Visibility Tool
- Using the Legend Tool
- Using the Change Projection Tool
Launching the Interactive Map
From the MAGIC home page, the interactive mapping tool can be accessed in two ways:
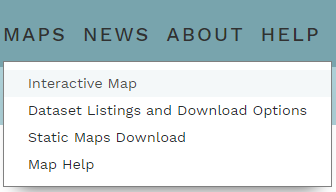
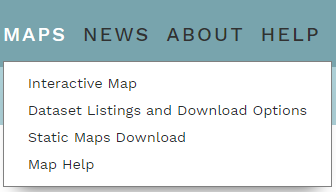
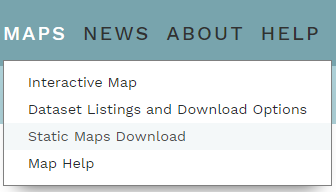
- Hover the mouse pointer over the ‘Maps’ box, at the top-right of the screen. From the drop-menu, select the ‘Interactive Map’ option:
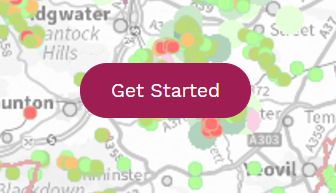
- Simply click the large ‘Get Started’ button:
Navigating the Website
The MAGIC website is intuitive, and offers a fluid user experience. As an aid, these navigational pointers may be of some benefit.
Any standard link that can be clicked will be displayed as a generic blue hyperlinked text element:

Some buttons will act as drop-menus. These do not need to be clicked. Simply hovering the pointer over the element will show the embedded options nested within:
Some of the elements within the Interactive Map have an arrow inset. Clicking the arrow will drop-down the menu options:
Table of Contents elements, in the Interactive Map, will have a right or downward pointing chevron symbol beside each text identifier. Clicking the chevron pointing to the right will expand the accordion down, and show the data elements within it. When the symbol is a downward pointing chevron, there are no deeper data layers to expose:
Downloading a Dataset
From the home page scroll the cursor over the Maps tab and select Dataset Download from the drop down list

The downloadable datasets are split into 2 options, those that are directly available from the site and those which are available from an external website.
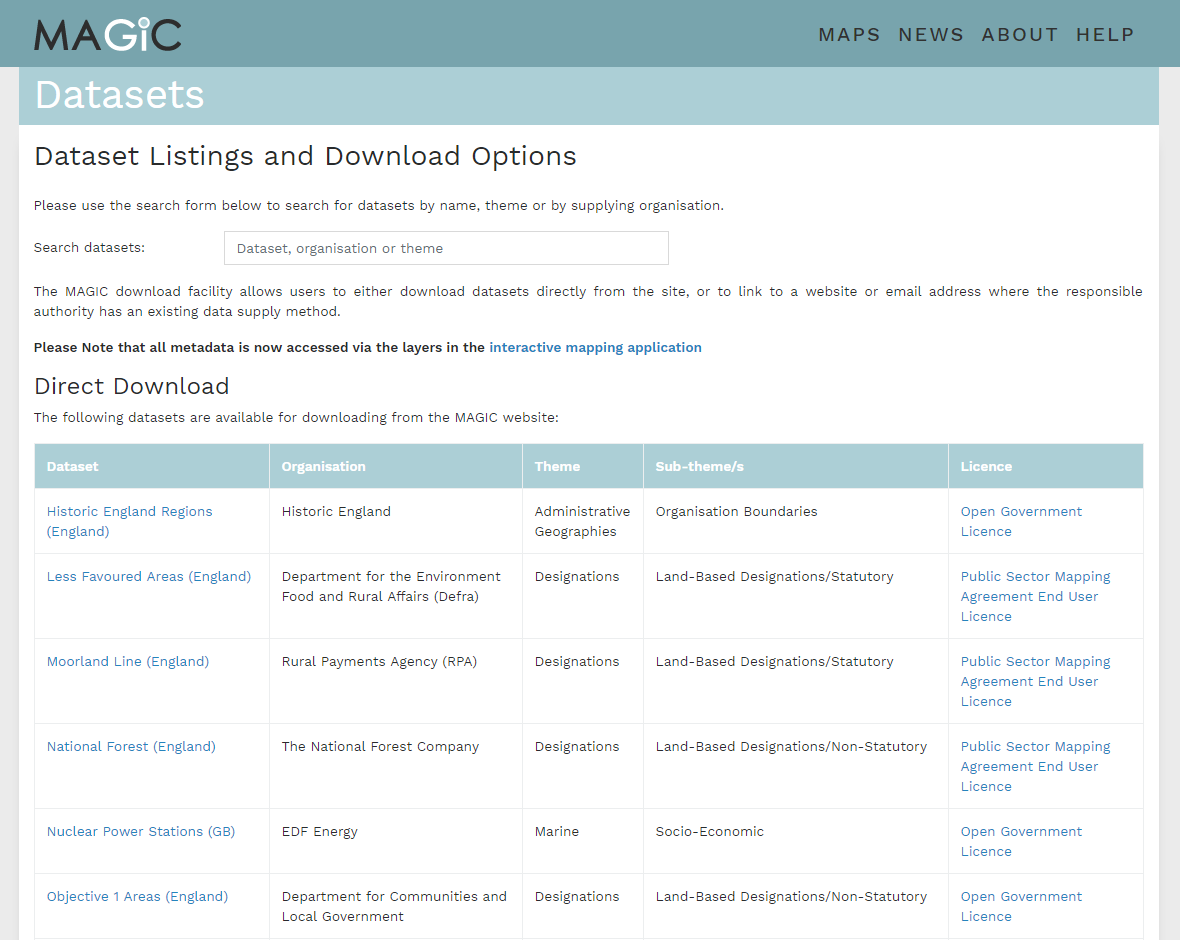
Direct Download - From the Dataset column, find the desired data and click on the hyperlink.
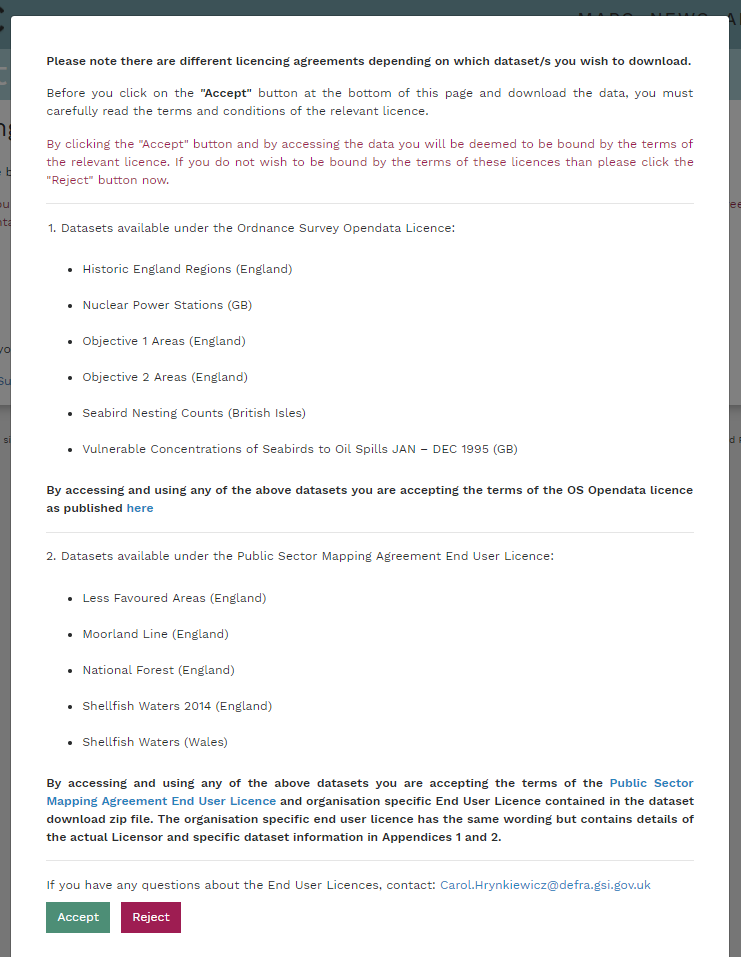
You are met with a Terms and Conditions page which you must Accept to obtain the Dataset.
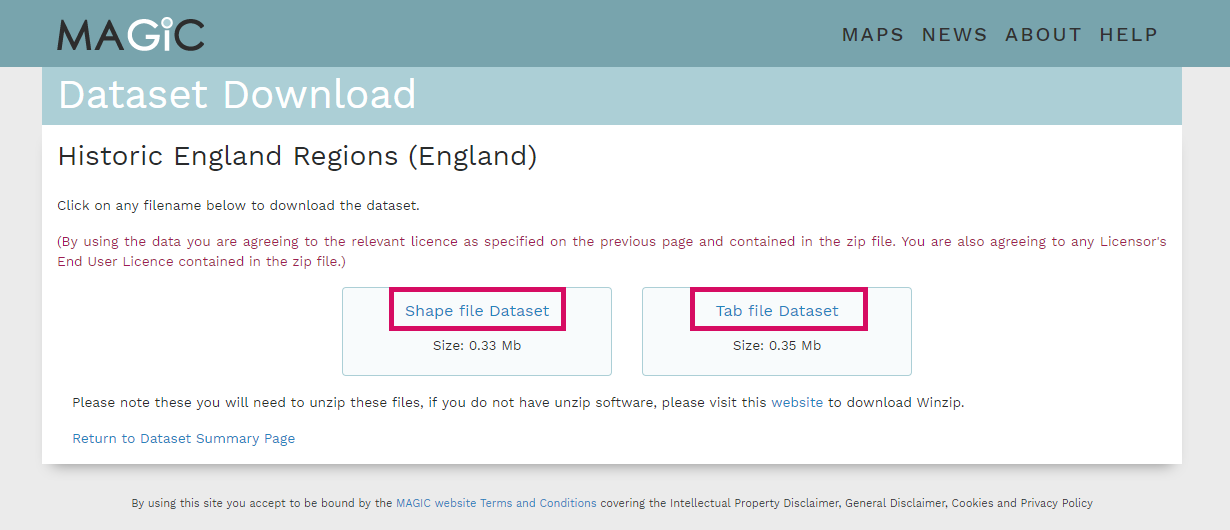
You are then shown the Datasets which can be downloaded in two common mapping formats. To begin the download, click on the preferred file type.
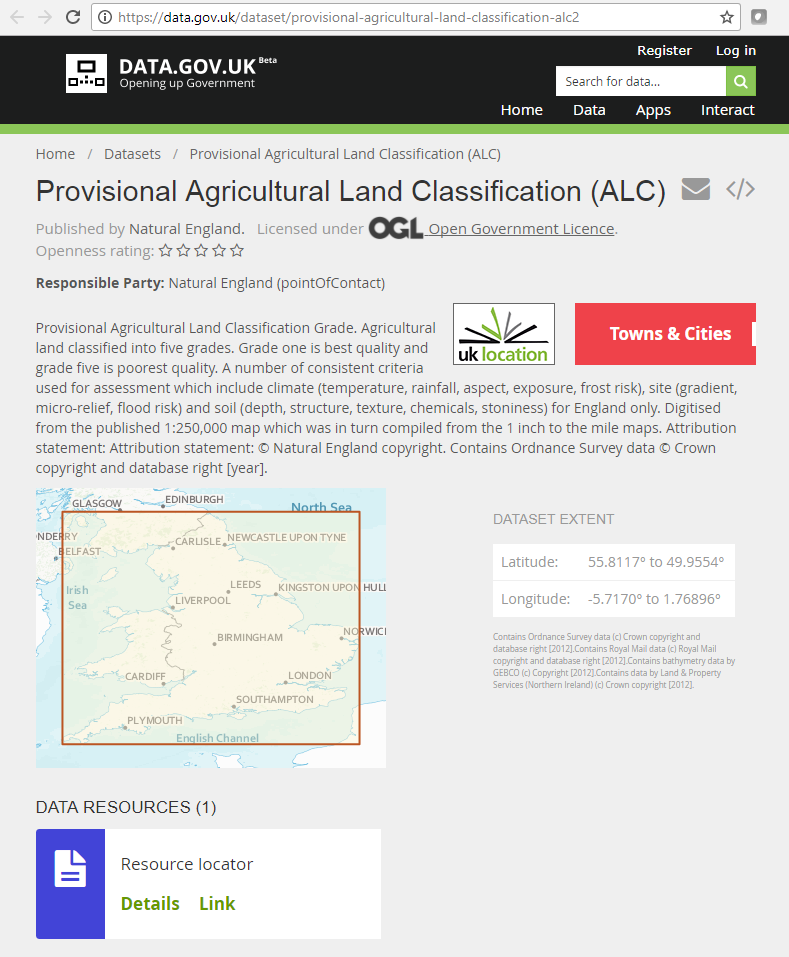
Link to Website - From the Dataset column, find the desired data and click on the hyper link.
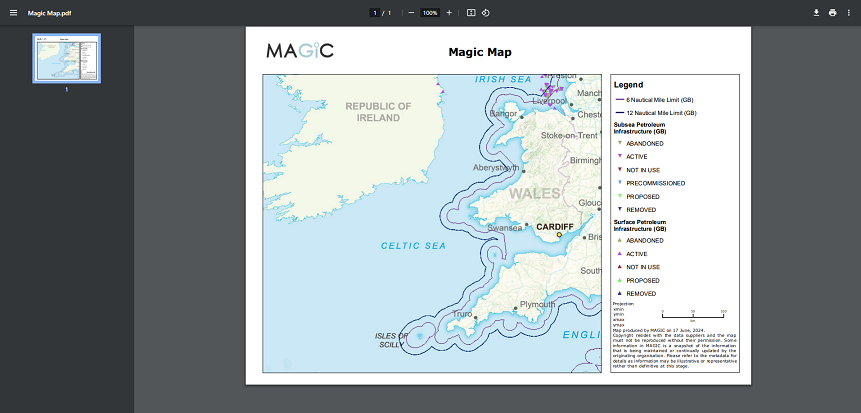
Static Maps
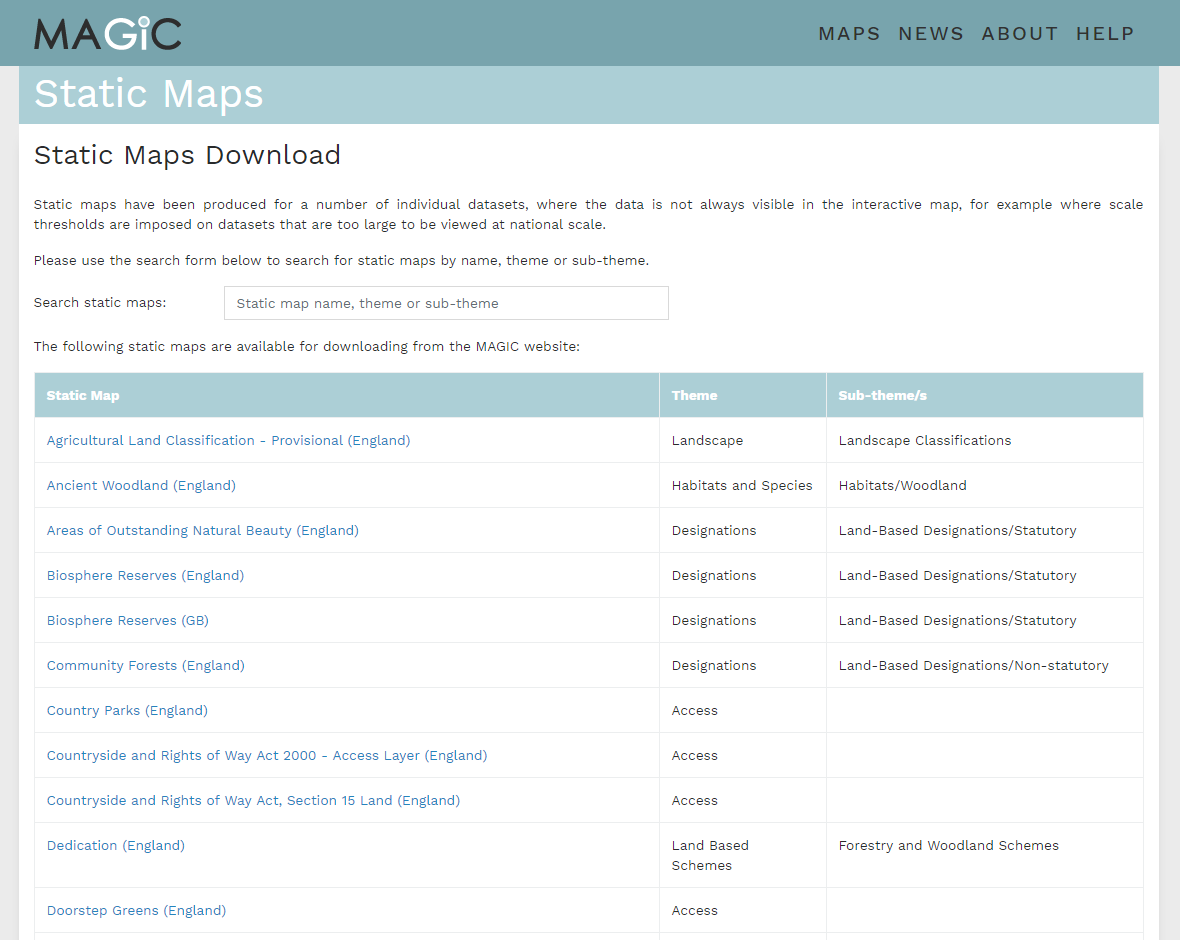
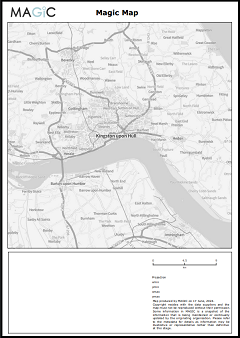
Static maps have been produced for a number of individual datasets, where the data is not always visible in the interactive map, for example where scale thresholds are imposed on datasets that are too large to be viewed at national scale.
From the home page scroll the cursor over the Maps tab and select Static Maps from the drop down list.
Click on the Name hyperlink to view, print or download the relevant map.
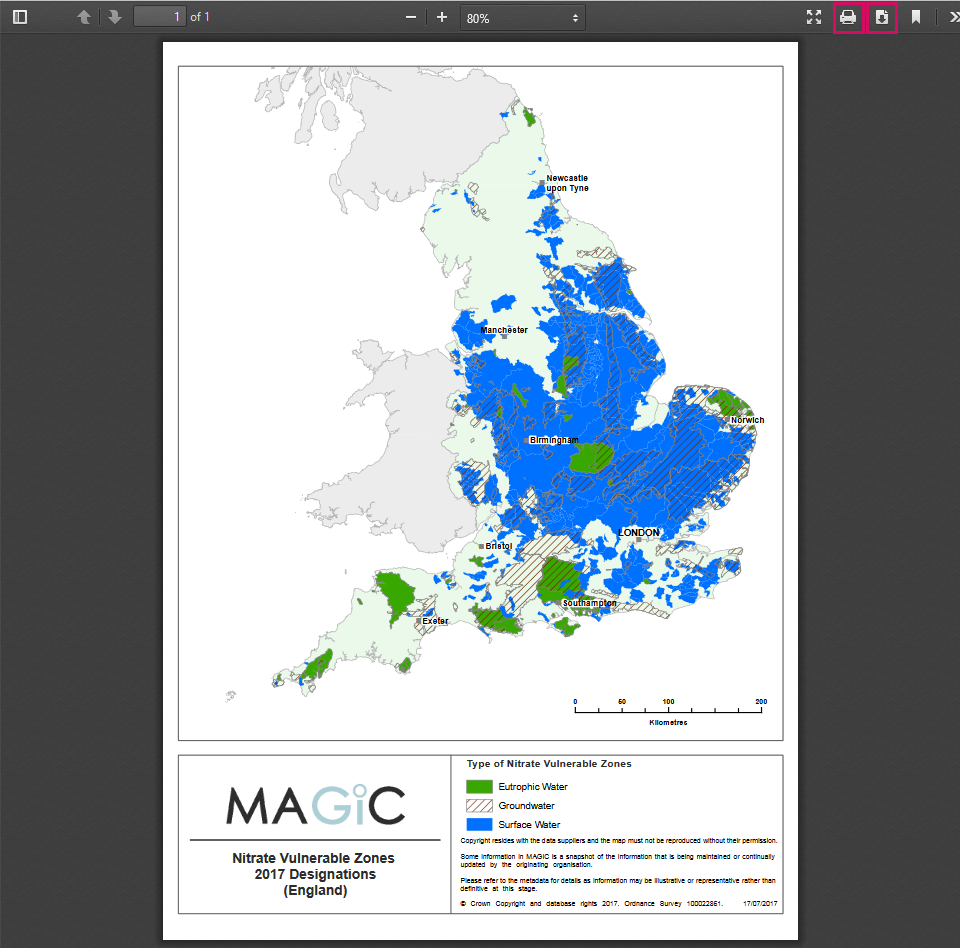
The static map will open in a new tab. The location of the Download and Print options will depend on the browser being used. For example with FireFox the print and download options will be at the top right of the screen, as shown below:
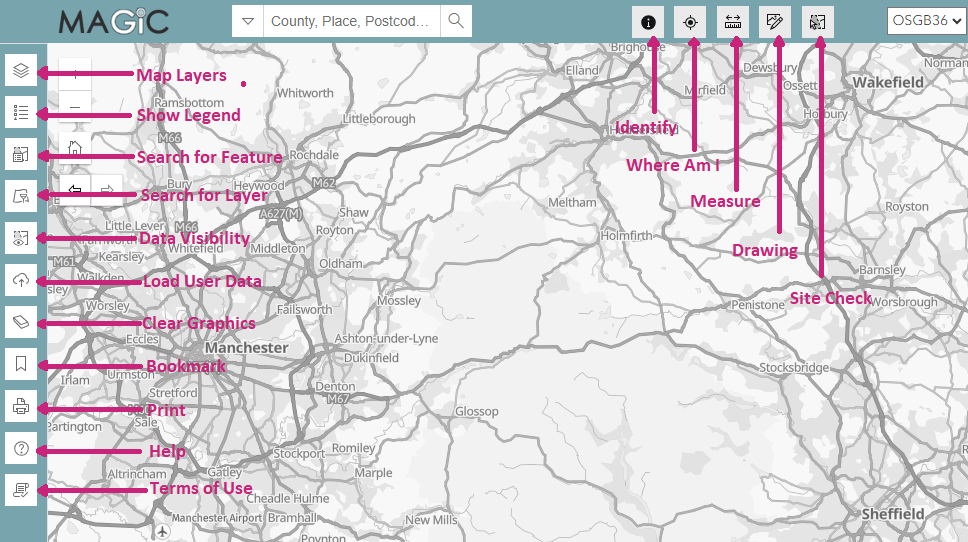
Navigating around the Map
The Interactive Map can be navigated in two main ways:
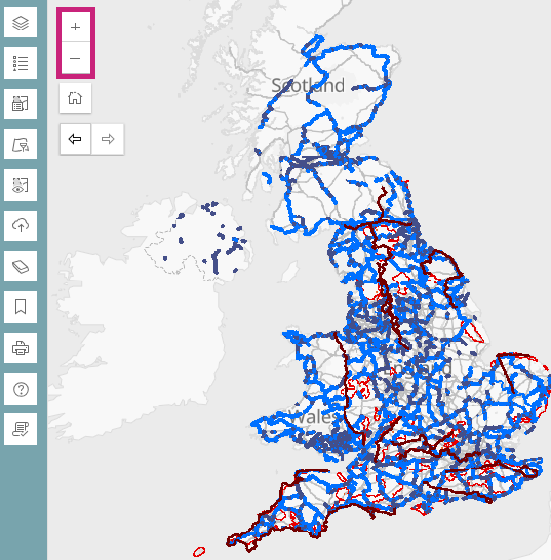
- The navigation tools (as pictured) offers a number of options for navigation:
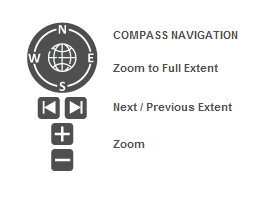
The Home button will zoom to Full Extent. The function has always been available in the drop down scale bar but it has now been also added to the interactive map for ease of use. The Zoom to Full Extent Tool allows you to zoom to the full extent of the map therefore allowing certain datasets to be viewed at national level.
The arrows are for Previous Extent and Next Extent. Clicking these will move to the last, and the next successive view extent that was viewed.
The top + and – buttons are for zooming in and out of the mapping view.
-
Simply click the large ‘Get Started’ button:
- Scroll wheel will zoom in and out.
- Left click, hold and drag will manually pan around the map extent.
Changing the Map Scale
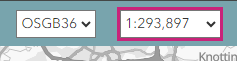
The current MAGIC interactive map scale is always displayed in the Set Map Scale box which can be found at the top-right of the interactive map page:
There are 2 simple ways to change the map scale in MAGIC:
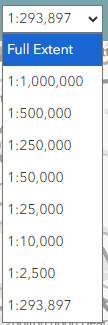
- Using a pre-set scale
To select from a pre-set range of popular scales, click on the down arrow and select a scale from the drop down list:
- Clicking the
 or
or  navigation icons on the map to zoom in or out of the map. This will change the map scale by ±50% for each click:
Using The Table of Contents (ToC)
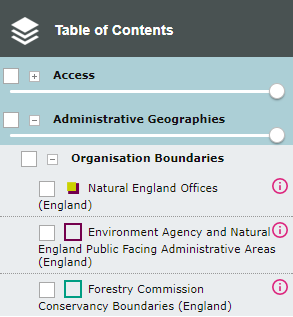
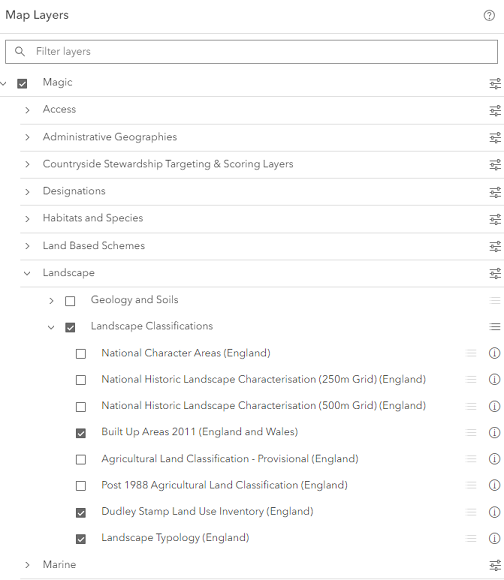
ToC Hierarchy/Structure:
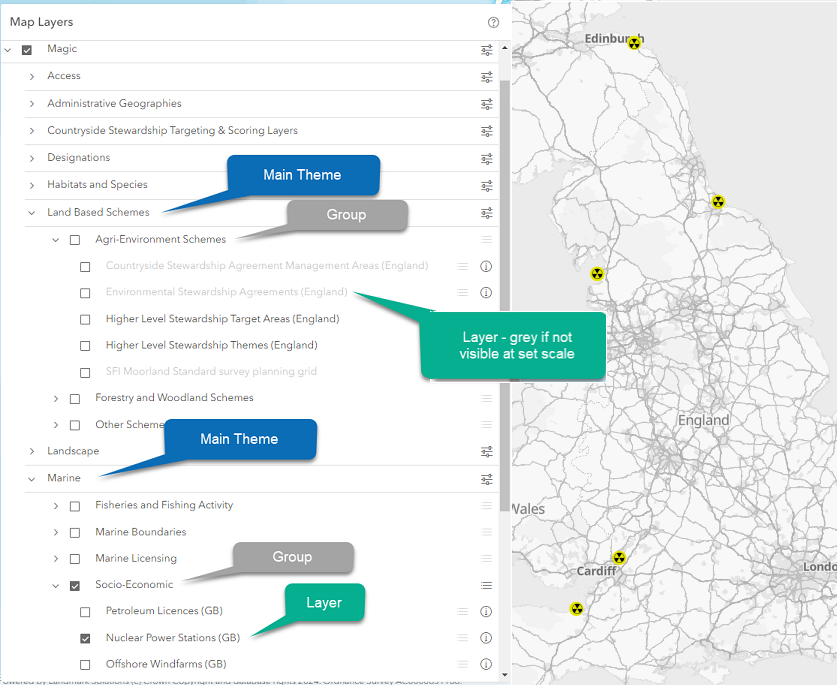
In the ToC there are two buttons: expand 1 and collapse 2 and three levels of tick box 3a, 3b, 3c
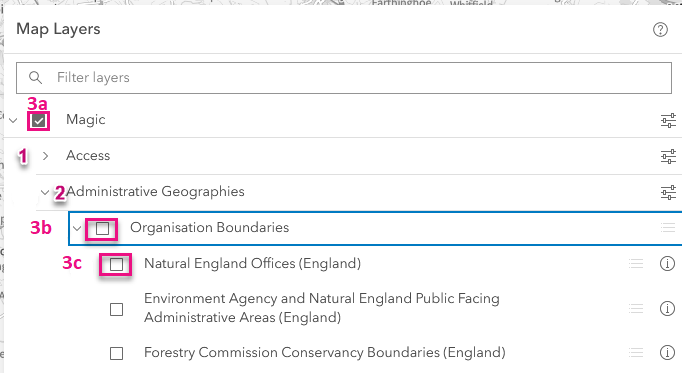
- Expand button. Click to expand the theme or sub-theme in order to see the layers contained within it – the button will change to a downward pointing chevron - note this does not actually turn on any layers.
- Collapse button. Click to close the theme or sub-theme and hide the layers contained within it – the button will change to a right pointing chevron - note this does not actually turn off any of the layers it merely hides them in the ToC. When the symbol is a downward pointing chevron, there are no further data layers to expose:
-
a. Magic layer (on by default)
- Empty tick box - next to a sub-theme e.g. Organisational boundaries – click this to make all the layers within that sub-theme visible if selected in step 3c - a tickBoxClick will appear in the box - click again to turn off the layers and the tickBoxClick will disappear.
- Empty tick box tickBox - next to a data layer – click to turn on that layer, making sure the sub-theme in step 3b has been selected - a tickBoxClick will appear in the box - click again to turn off the layer and the tickBoxClick will disappear. Please note that some data layers will not appear until certain zoom thresholds have been reached.
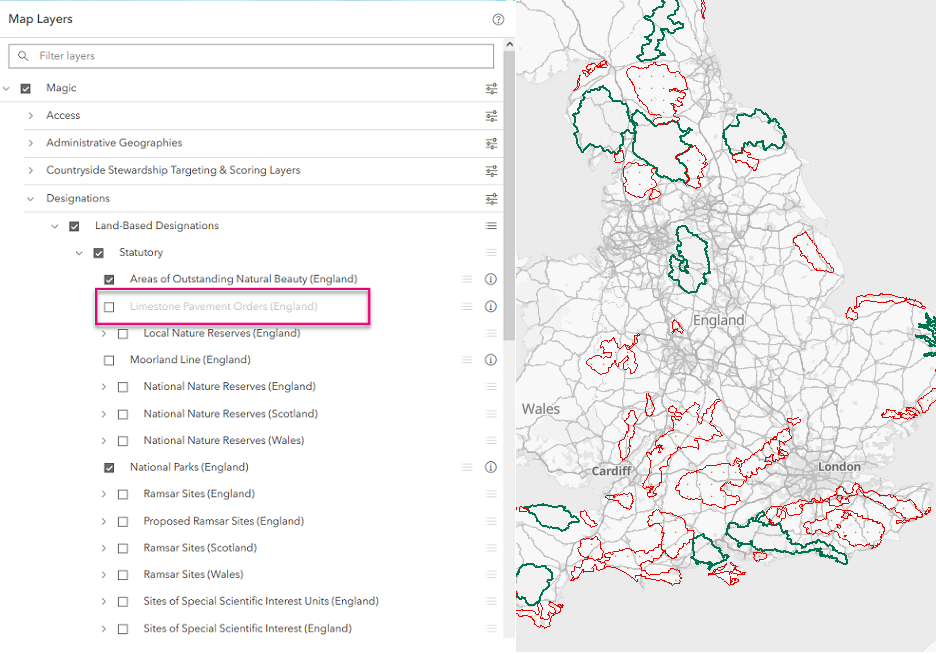
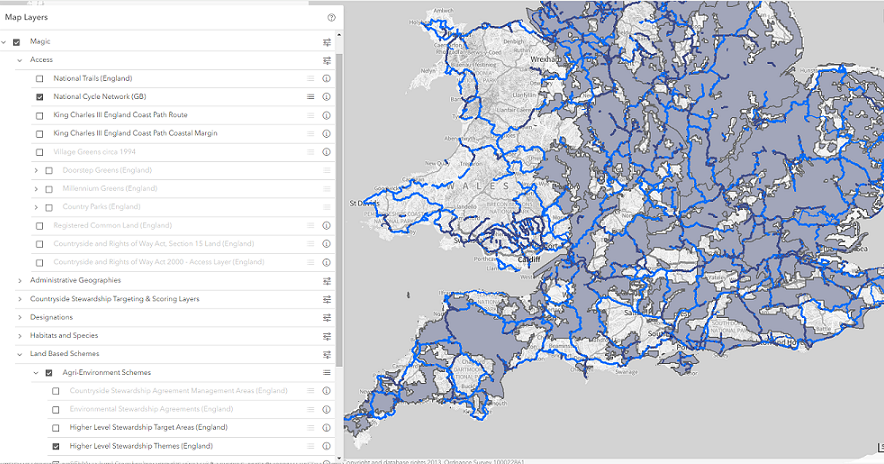
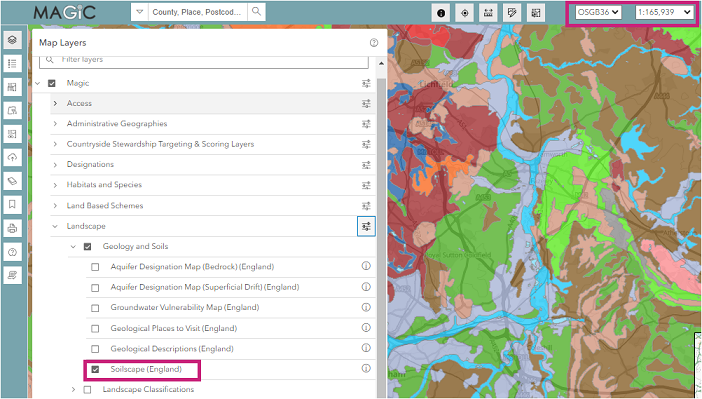
Where a layer name is greyed out in the ToC e.g. Limestone Pavement Orders in the image below, it will not be visible in the interactive map at that scale because it has a scale threshold set on it. This document outlines the scales that layers are visible at.
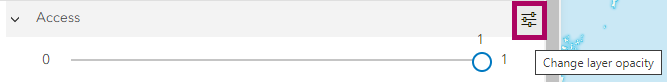
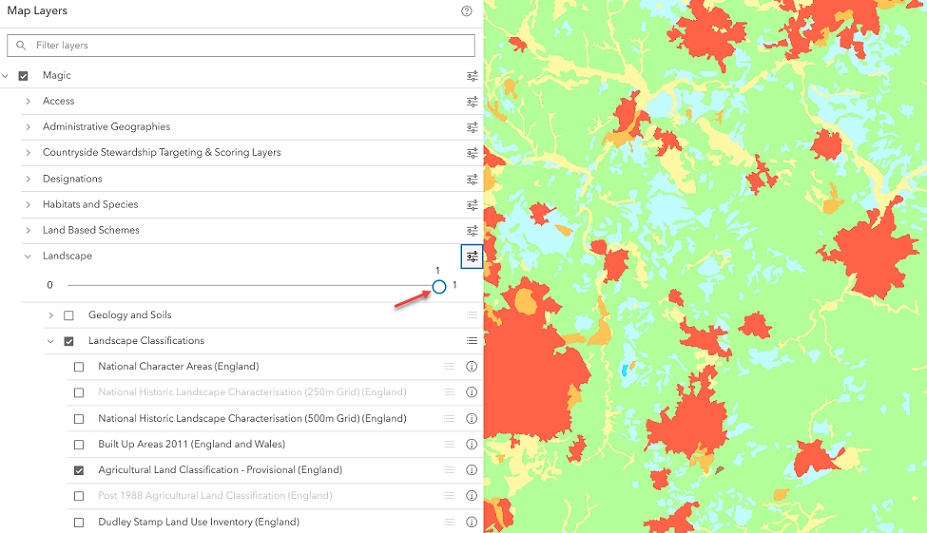
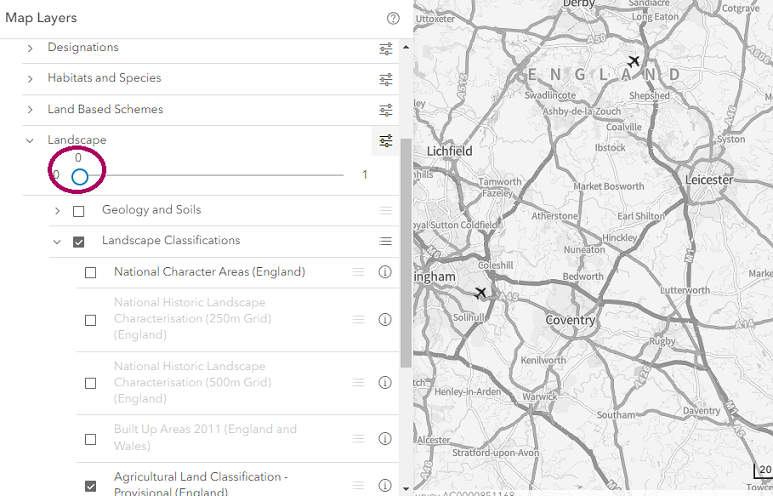
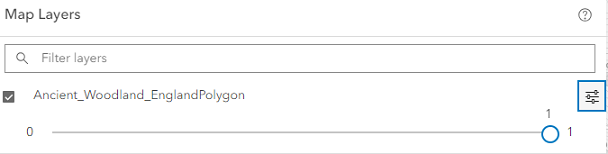
Each MAGIC theme has a variable transparency slider underneath its name. This feature allows users to determine the levels of transparency of the datasets so that the base mapping can be seen more clearly. The far right is total opacity, and the far left is total transparency. Variances in between can easily be set to user preference.
100% Opacity:
50% Opacity:
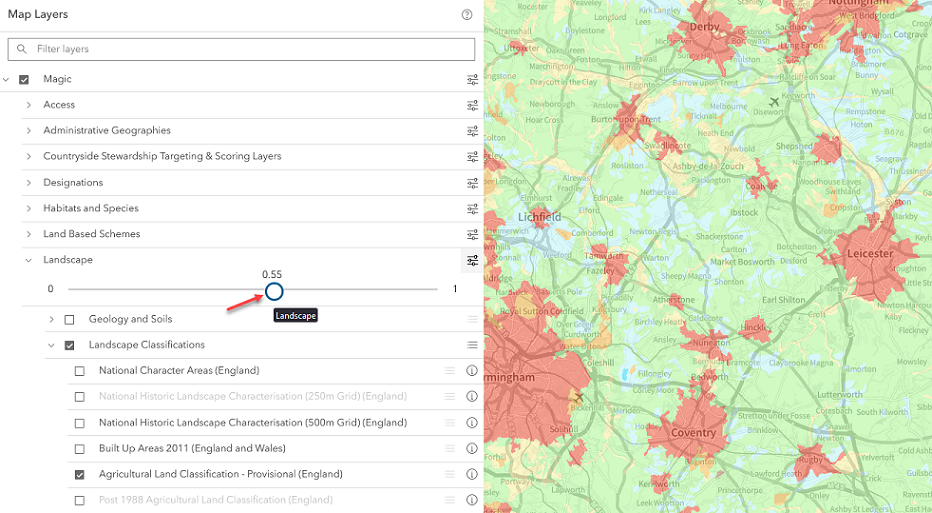
0% opacity i.e. transparent:
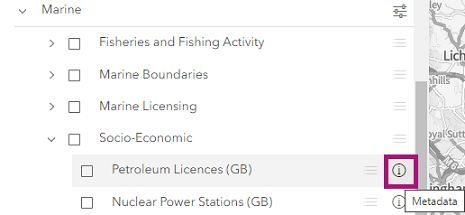
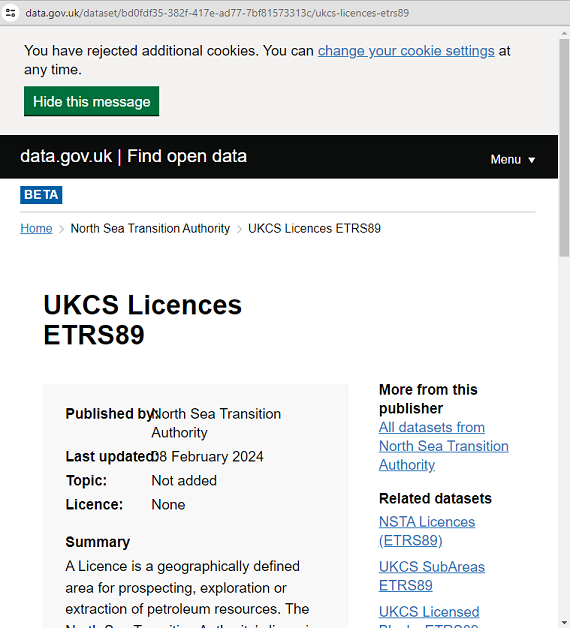
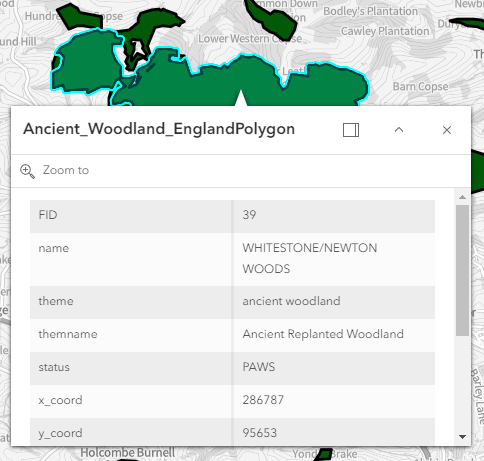
To view the associated metadata for each ToC layer, click the ![]() to the right of the layer name. This will open up the metadata window, which explains the dataset in greater detail:
to the right of the layer name. This will open up the metadata window, which explains the dataset in greater detail:
Searching the Map
The Map Search tool, is found at the top-left of the Interactive Map page:

To perform a search, simply enter a search term, and click the magnifying glass icon, to the left of the search field. The search will perform, and the map will navigate to display the search results.
There are 3 search types are as follows:
-
The default search is COUNTY, PLACE OR POSTCODE which allows you to search for any of the following (the search will automatically recognise, from the text you enter, whether it is a county, place or postcode):
- counties
- towns, cities, locations, etc;
- postcodes and postcode areas
NB: if you want to search by Region or Coordinates/Positions you will need to select the relevant data type by clicking the down arrow icon, on the left of the search field and selecting the relevant data type
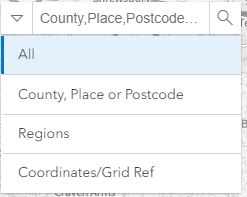
- REGIONS: allows England regions to be searched (north east, etc.)
- COORDINATES / POSITIONS: allows coordinates and grid references to be searched for.
The Coordinates/Positions search will support a number of different coordinate formats:
- 6 digit British National Grid in the format (only for OSGB36 projection): e.g. SX 123 456 (spaces optional)
- Easting & Northing metres (only for OSGB36 projection): e.g. 123456, 234567 or 123456 234567 (, is optional)
- Latitude Longitude pairs in any of the following formats (brackets are optional):
Map Tools
There are 15 interactive feature tools on MAGIC:
See help sections below for information on how each individual tool works.
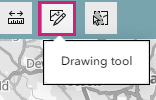
Using the Drawing Tools
Drawing Tools can be accessed by clicking the pencil icon in the Feature Tools section at the right of the mapping window:
EDITING YOUR DRAWINGS
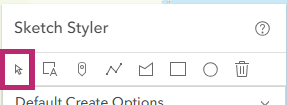
Select the upward pointing arrow and click on the drawn shape to manually edit, re-size or move it. It also allows for a selected shape to be deleted using the DELETE key on your keyboard.
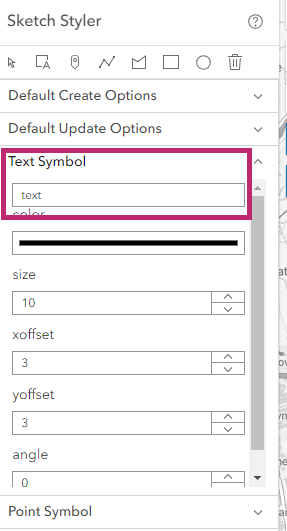
ADDING TEXT
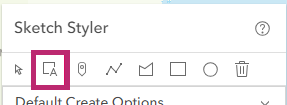
Input your desired text in the Text Symbol drop down menu within Sketch Styler, and then select the 'Add Text (A)' option to manually add text by clicking at a point on the map where you wish the text to be displayed. Follow this process for each new text entry you want to add to the map. To enlarge the text on the map, select the upward pointing arrow, click on the text to highlight, then choose a larger size and the drag the text to a new location or delete and add a new text symbol.
ADDING POINTS
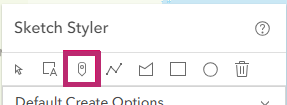
The Point tool allows points to be added to the map, at your chosen location. Multiple points can be added to the map using the same method.
ADDING LINES
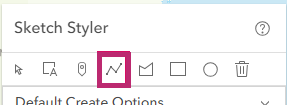
Select the Line tool to manually add straight lines to the map (this can include lines with changes of direction). To add a line, select the line tool and click on the map at the start of the line, move and click to continue drawing the line, double click to finish drawing it. Multiple lines can be added to the map using the same method.
ADDING RECTANGLES OR SQUARES
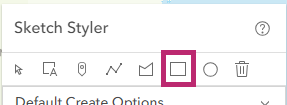
To add a rectangle or square left click the Rectangle tool (square) then click on the map to start the first corner of your rectangle and move to define your area, double click go to finish. Multiple rectangles or squares can be added to the map using the same method.
ADDING CIRCLES
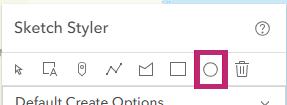
The Circle tool works in exactly the same way as the Rectangle tool. The difference is that the user can create circles to their desired size.
ADDING POLYGONS
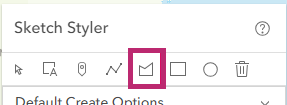
To add a user-defined polygon consisting of a series of straight lines, select the polygon tool and click at each successive point that you wish the polygon to include. This could range from a simple three sided triangle to a more complicated shape of multiple sides and angles. To complete the polygon, double click, and the polygon will be automatically completed and shaded.
DELETING ALL SHAPES
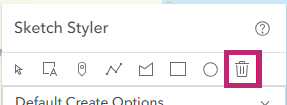
To remove all user graphics on the map, select the Delete All (x) tool. If confirmed at the prompt, all added graphics will be removed from the map. To remove a single graphic instead, use the editing tool (upward pointing arrow, featured under Editing your Drawings above).
STYLING TOOLS
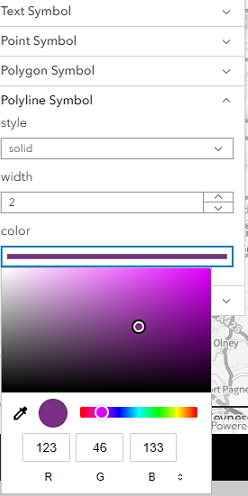
The styling tools allows for text, points, polygons and polylines to be given a different style, width, outline, size, offset and colour. The colour can be chosen from a colour picker or a specified custom colour using RGB, HSL or hexadecimal values. The selected options will apply for the relevant styling until another is chosen. It may be easier to set your styling options before you start drawing.
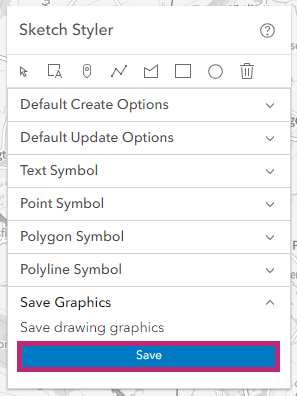
SAVE THE GRAPHICS
If you would like to save the graphics you have drawn, for use in your own Geographic Information System (GIS) - click the Save button in the Drawing Tools window.
The graphics will be converted to shapefile format. Based on settings of your browser, either a window will appear asking you to specify the name of the file and the location where you would like to save it to or the file will be saved into your default downloads location.
Searching the Map Layers
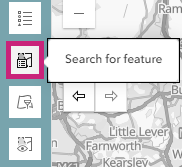
To search within a data layer, the layer must be checked in the Table of Contents as visible. When the Search for a Feature icon is clicked, the main search window will open:
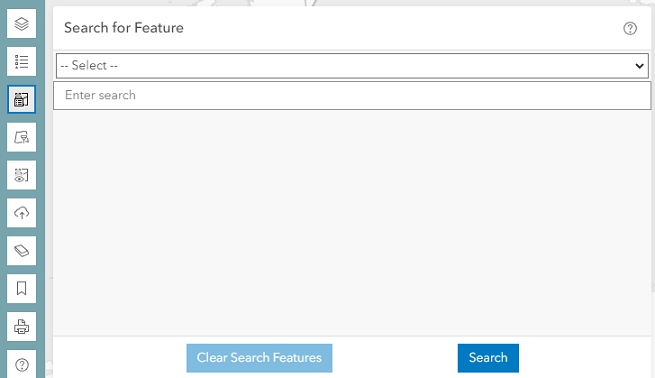
To select a data layer for searching, click the arrow image on the right of the Select Layer field. This will display a drop menu of all available options. Only one layer can be searched on at any one time.
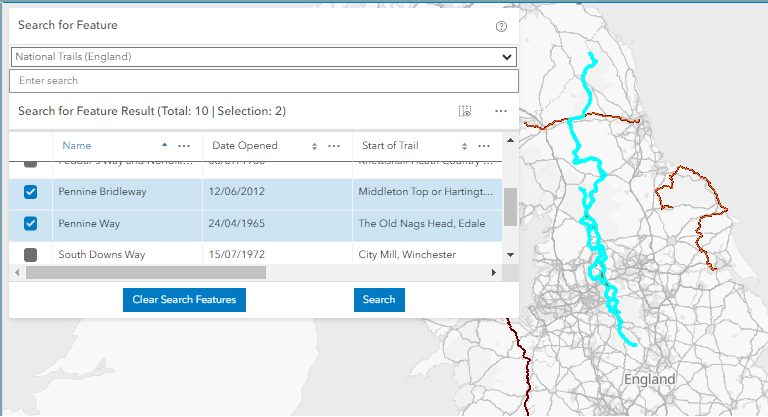
To perform the search, enter a search term in the Enter Search field, and click ‘SEARCH’. The search will execute, and the results will be displayed in the mapping window.
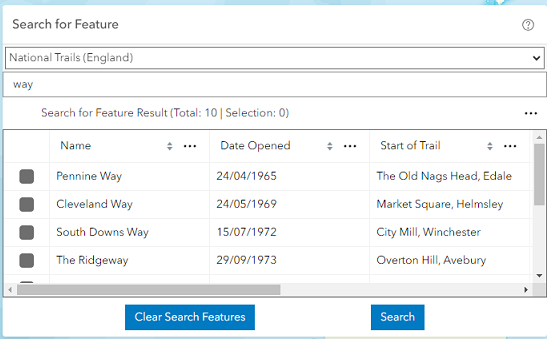
The results will be displayed in a data window, with relevant data fields populated. To view a single result within the map, click the tick box for the relevant row or select more than one row to view multiple results. To sort the results in alphabetic or numeric order click on any column header.
Searching for a Dataset
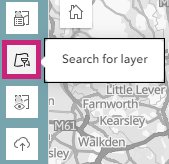
To search for a dataset click on the Search for Layers icon, a search window will open.
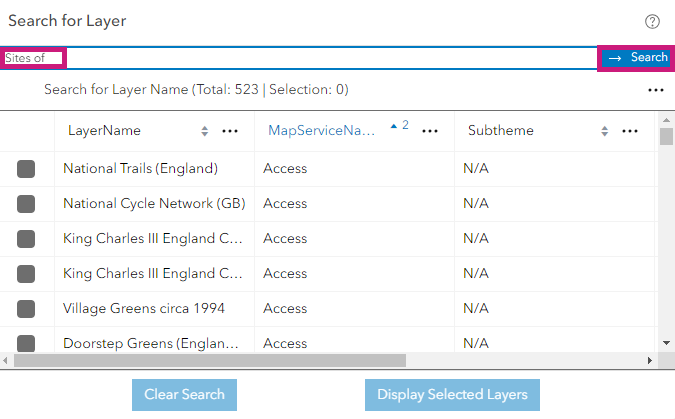
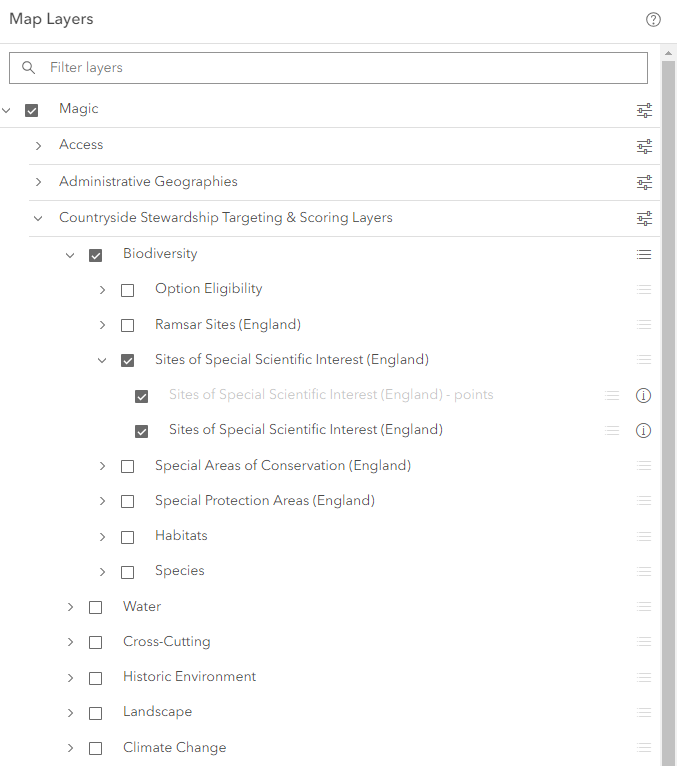
To search for a dataset enter text and click Search. Results will be displayed in the table. You can select the dataset/datasets you are interested in and click on the Display Selected Layers to view them on the map
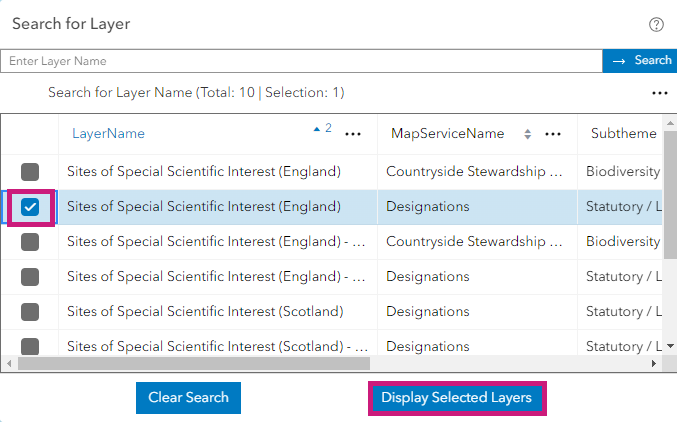
The Theme column provides information on which theme/themes the datasets sit within. The Min and the Max scale columns provides information on what scales the data can be viewed at.
Using the Site Check Tool
Before you use the site check tool button, the first thing you need to do is ensure all the layers you want to search are selected (ticked in the Table of Contents (ToC). NB the number of layers you select will affect the speed of the site check - too many layers may result in slow site checks or error messages:
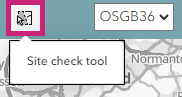
From the Feature Tools bar above the map select the Site Check button:
A new window will appear:
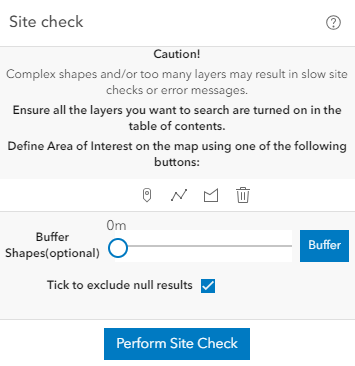
There are three different options (buttons) for doing a site check which are explained in more detail further down this section:
![]() To do a site check at specific point
To do a site check at specific point
![]() To do a site check along a line
To do a site check along a line
![]() To do a site check within a defined area (polygon)
To do a site check within a defined area (polygon)
![]() This button allows you to delete all site check graphics you have drawn
This button allows you to delete all site check graphics you have drawn
![]() Ticking this box will exclude any null results i.e. features from datasets that are selected but are not in the area of interest.
Ticking this box will exclude any null results i.e. features from datasets that are selected but are not in the area of interest.
![]() Once you have defined the point, line or area of interest on the map, click the Perform Site Check button to generate the site check results which will appear in a new window and will only provide information relating to the layers you have selected (ticked in the Table of Contents (ToC). By default the site check includes null results for any features selected but not in the area of interest. If you wish to exclude null results, click the Tick to exclude null results box at the bottom of the site check window before clicking on perform site check:
Once you have defined the point, line or area of interest on the map, click the Perform Site Check button to generate the site check results which will appear in a new window and will only provide information relating to the layers you have selected (ticked in the Table of Contents (ToC). By default the site check includes null results for any features selected but not in the area of interest. If you wish to exclude null results, click the Tick to exclude null results box at the bottom of the site check window before clicking on perform site check:
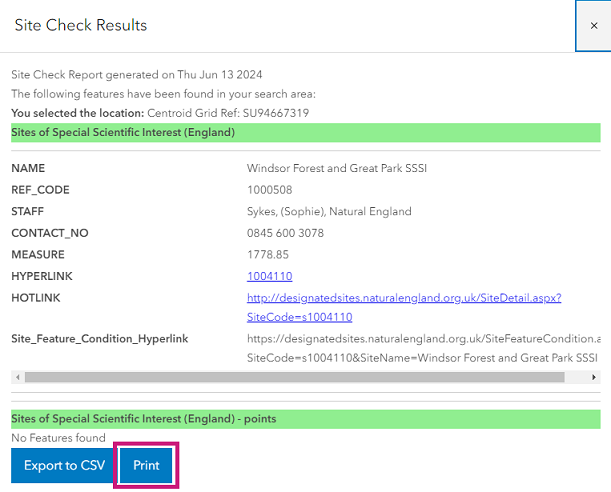
The site check can be printed by clicking the Print button at the bottom right hand side of the window. The site check can also be saved by following the instructions in our FAQ section M13: Can I save a site check report in MAGIC?
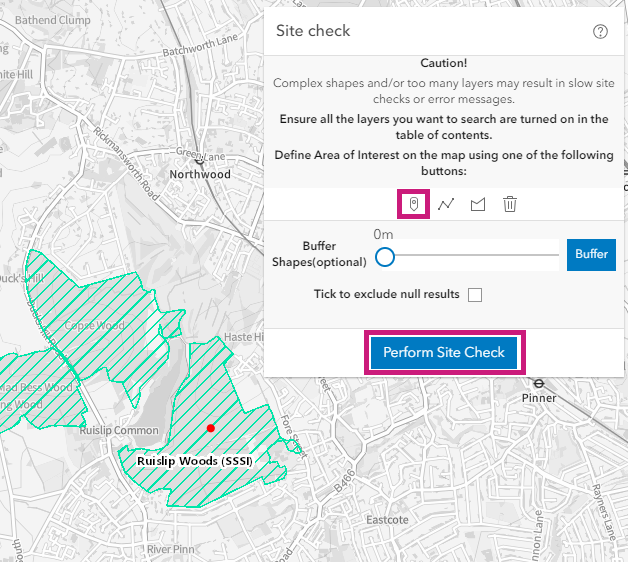
Site Check at a specific point
Click the point icon on the pop up window and then click on the map at your point of interest. Click the ‘Perform Site Check’ button on the window and a report will be generated with a list of features found at that point:
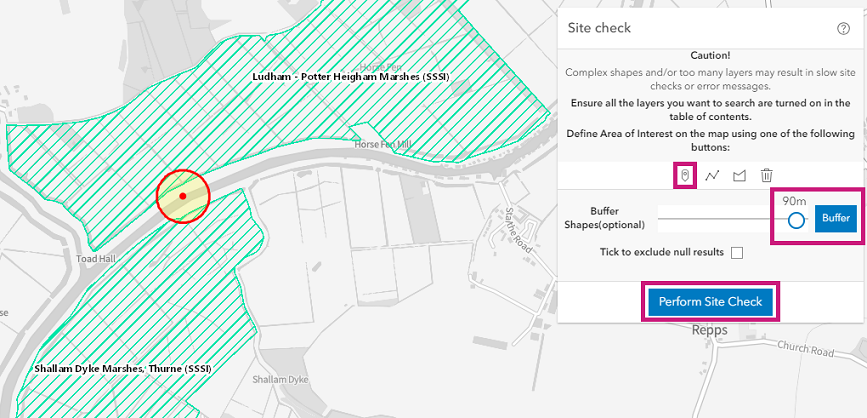
Site Check within a given radius of a point
Click the point icon on the pop up window and then click on the map at your point of interest. Choose your required distance in metres (up to a maximum of 100 metres) using the slider next to the words ‘Buffer Shapes (optional)’ then click the Buffer button. This will draw a circle of the given radius around the point. Click the ‘Perform Site Check’ button on the window and a report will be generated with a list of features found within the set radius of the point:
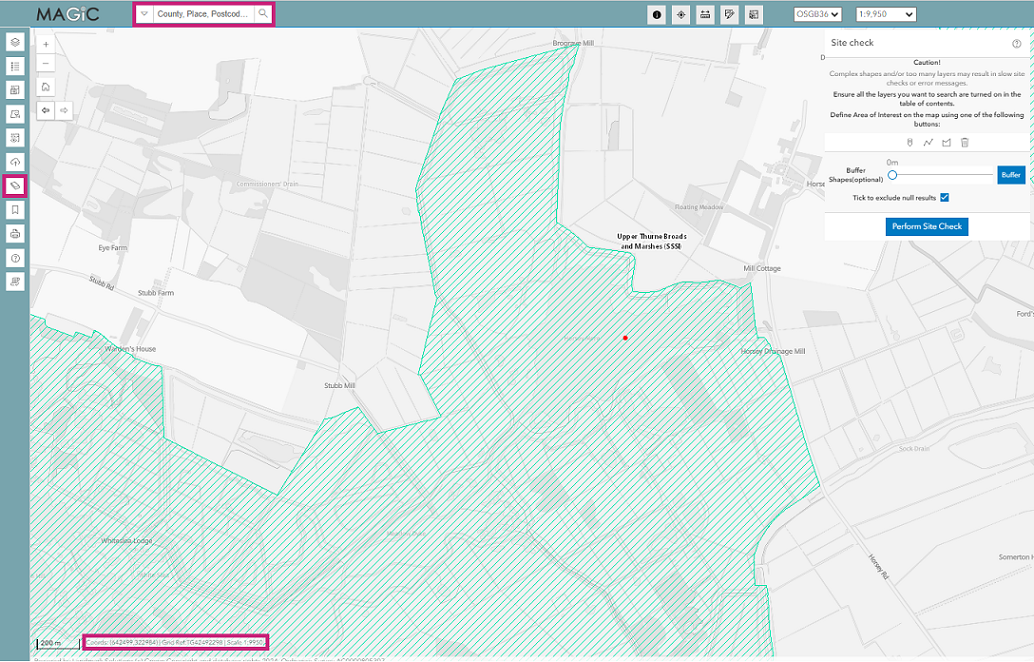
Site check at or around a grid reference
This is carried out in the same way as Site check at a specific point or Site check within a given radius of a point explained above; however you will need to navigate to your required grid-reference before clicking on the map. This can be done in 2 ways:
- As you move the cursor around the map the roaming grid co-ordinates can be seen in the bottom left hand corner of the map. Once you can see your required grid reference click on the map:
- Use the Map Search Tool above the Table of Contents. Change the search type to co-ordinates/positions (by clicking the down arrow) and type in your grid reference, then click the magnifying glass icon, to the left of the search field. The map will navigate to the grid reference which will be shown by a blue dot. Click the point icon on the site check pop up window and then click on the map where the blue dot is. To see the red site check point you will need to use the Clear Selected Features button above the map to remove the blue dot:
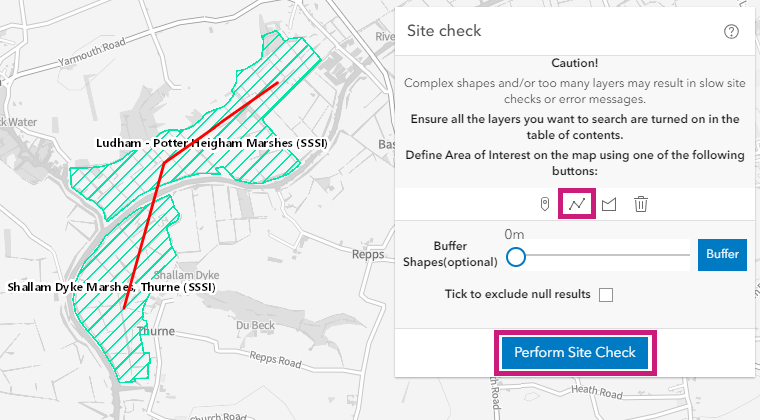
Site Check along a line
Click the line icon on the pop up window and then click on the map to start drawing your line. Continue clicking to draw your line and then double click to finish the drawing. Click the ‘Perform Site Check’ button on the window and a report will be generated with a list of features found along the line:
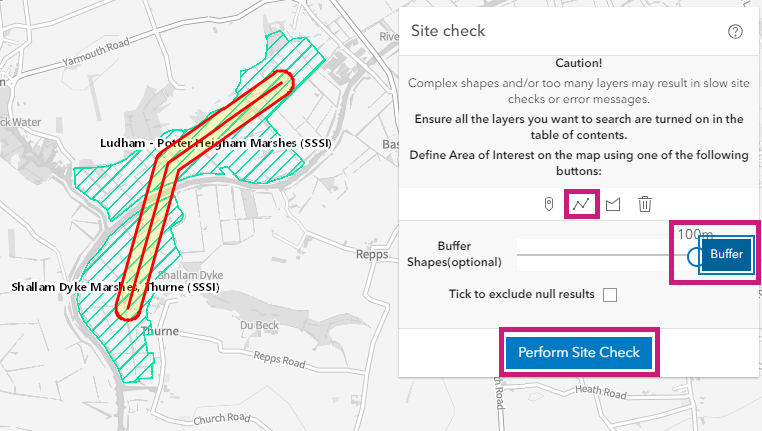
Site Check within a given distance of a line
Click the line icon on the pop up window and then click on the map to start drawing your line. Continue clicking to draw your line and then double click to finish the drawing. Choose your required distance in metres (up to a maximum of 100 metres) using the slider next to the words ‘Buffer Shapes (optional)’ then click the Buffer button. This will draw a buffer zone around the line for the given distance. Click the ‘Perform Site Check’ button on the window and a report will be generated with a list of features found within the set distance of the line:
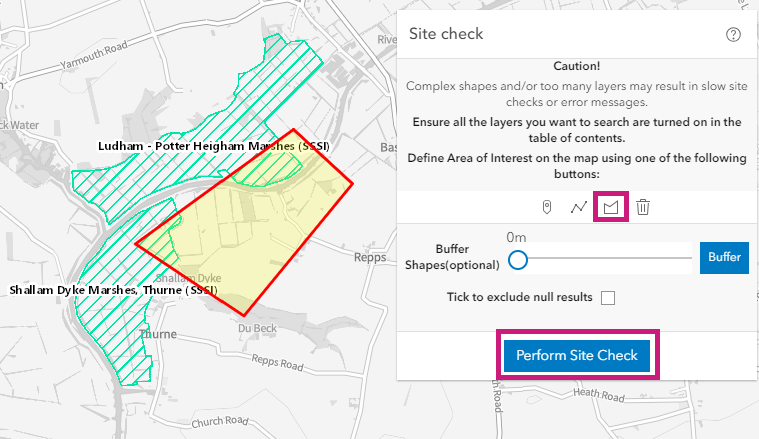
Site check within a defined area (polygon)
Click the polygon icon on the pop up window and then click on the map to start drawing your area. Continue clicking to draw your area and then double click to complete the polygon. Click the ‘Perform Site Check’ button on the window and a report will be generated with a list of features found within your defined area:
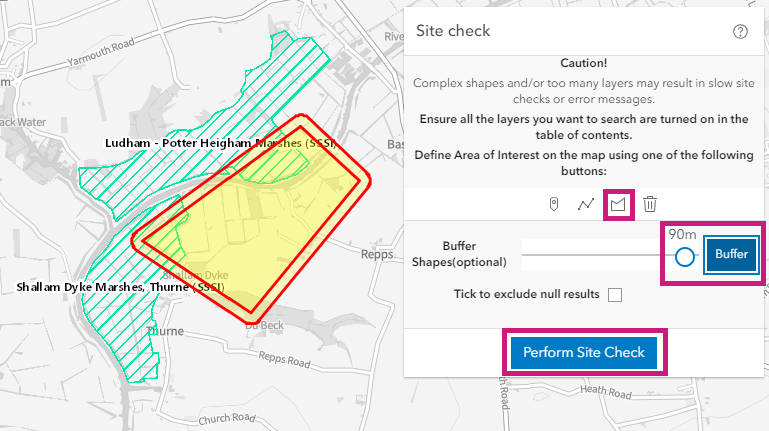
Site check within a defined area (polygon) with an added buffer
Click the polygon icon on the pop up window and then click on the map to start drawing your area. Continue clicking to draw your area and then double click to complete the polygon.Choose your required distance in metres (up to a maximum of 100 metres) using the slider next to the words ‘Buffer Shapes (optional)’ then click the Buffer button. This will draw a buffer zone around the outside of the polygon for the given distance. Click the ‘Perform Site Check’ button on the window and a report will be generated with a list of features found within the polygon and the buffer zone:
If you regularly do site checks for the same layers consider creating a bookmark as this will save you having to re-select the same layers each time – see the Using the Bookmark Map Tool help section in this Help Library.
If you regularly do site checks for the same layers consider creating a bookmark as this will save you having to re-select the same layers each time – see the Using the Bookmark Map Tool help section in this Help Library.
![]() By clicking on the CSV button you can export the results of the site check.
By clicking on the CSV button you can export the results of the site check.
Using the Clear Selected Feature Tool
From the Feature Tools list click on the Clear Selected Feature tool.
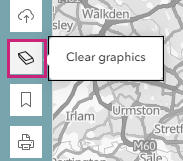
Clicking on this tool will clear any of the following from the map:
- The blue polygon that appears on the map when you do a search for Regions, Counties or Postcodes
- The blue dot that appears when you search for Coordinates/Positions
- The blue point, line or polygon highlighting any features that have been searched for using the Search for a Feature tool
- Measurement lines and polygons
- Site Check points, lines or polygons once the site check has been performed
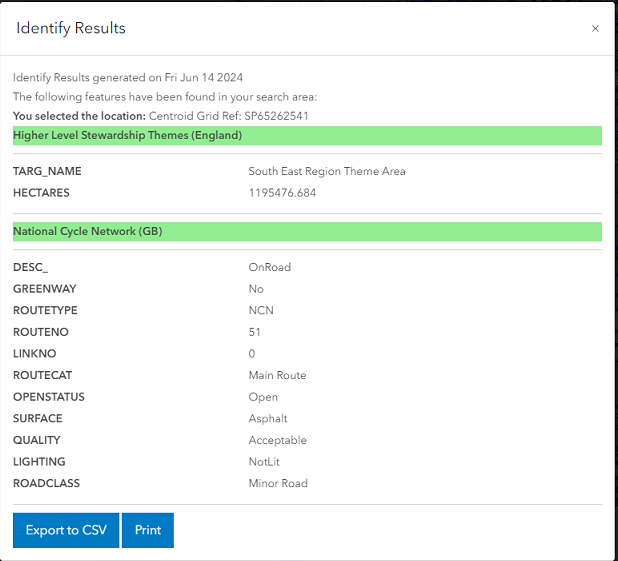
Using the Identify Feature Tool
With features displayed on the Interactive Map
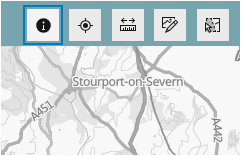
Click the 'i' button which is located in the Feature Tools list
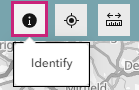
The 'i' button will now appear with a blue highlight and the cursor will change to a cross to indicate you can now click on the Map to Identify Features.
When the Interactive Map is clicked with the Identify tool selected you will be shown a new window that lists all of the features present for the area you selected. You can then either print the results or export them to csv.
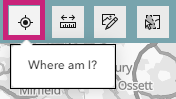
Using the Where Am I Tool
From the Feature Tools select the Where Am I? tool.
With the cursor, click anywhere on the map. A new window appears with information for the point you just clicked on the map.
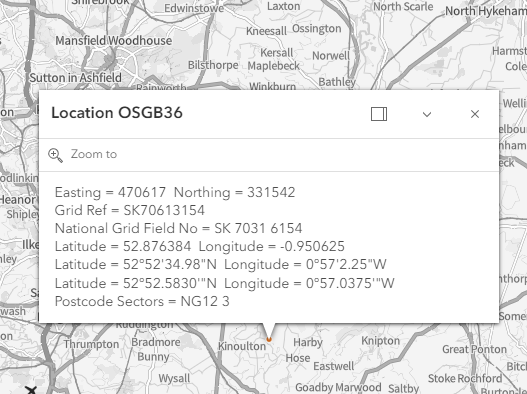
The information listed is Easting & Northing, Grid Reference, Latitude & Longitude, Postcode Sectors and National Grid Field Number. N.B. For the most accurate field number click in the centre of the relevant field.
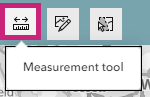
Using the Measure Tool
From the Feature Tools list click on the measuring tool.
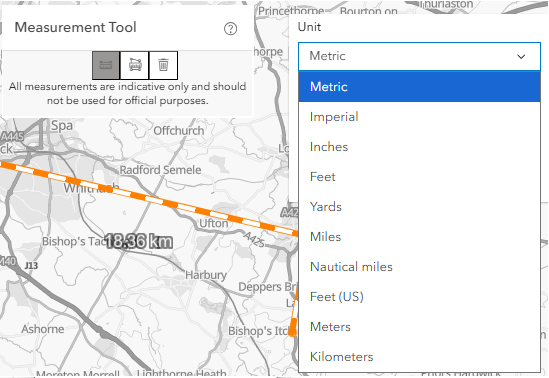
A new window will appear over the map with two measuring options, Area & Perimeter and Distance.
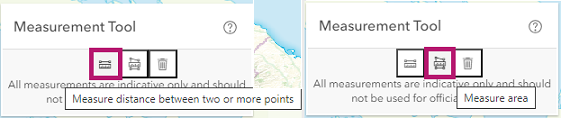
To measure a line/distance, select ![]() and then click anywhere on the map to start using the tool. Continue to move the cursor and click on the map to draw your line.
and then click anywhere on the map to start using the tool. Continue to move the cursor and click on the map to draw your line.
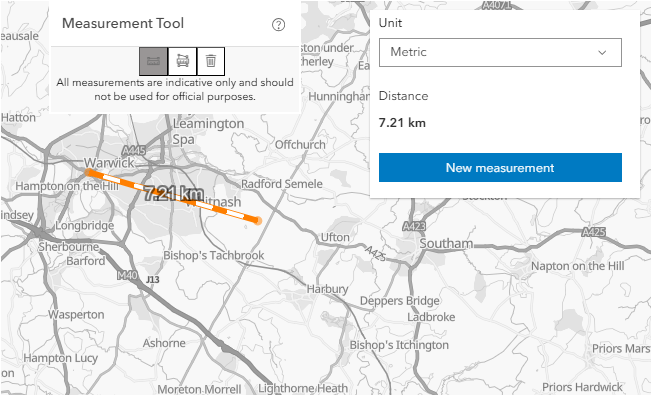
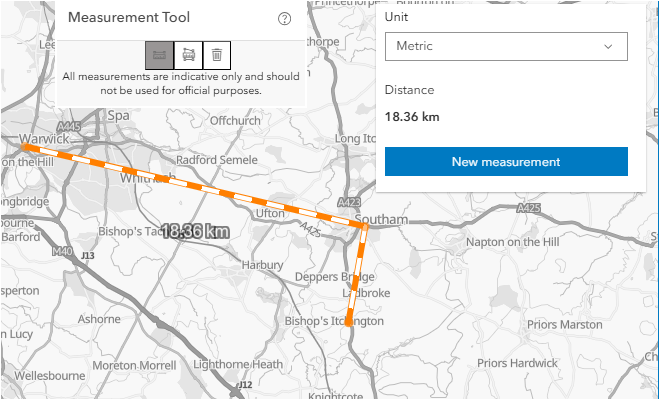
To view the final measurement you need to double click the left button on the mouse to finish drawing.
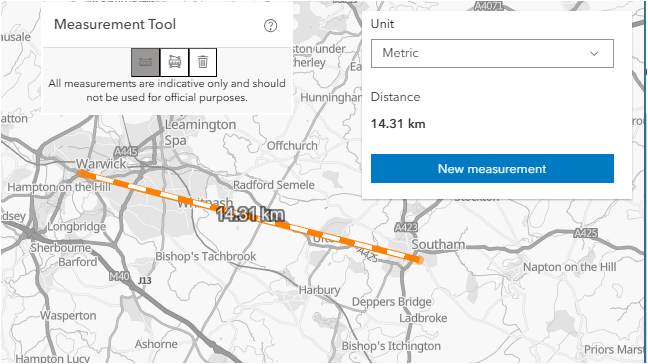
Once double clicked the final result will be displayed within the pop up window.
The default measurement is in Metric but you can change this by clicking the downwards facing arrow next to Metres, the other measurement options are: Imperial, Inches, Feet, Yards, Miles, Nautical miles, Feet (US), Metres and Kilometers.
To measure an area and perimeter select ![]() from the measurement tool window and then click anywhere on the map to start using the tool. Continue to move the cursor and click on the map to draw your polygon.
from the measurement tool window and then click anywhere on the map to start using the tool. Continue to move the cursor and click on the map to draw your polygon.
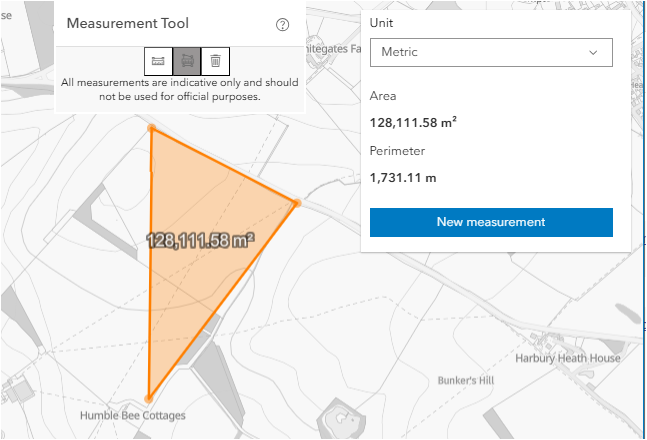
To view the final measurement you need to double click the left button on the mouse to complete the polygon.
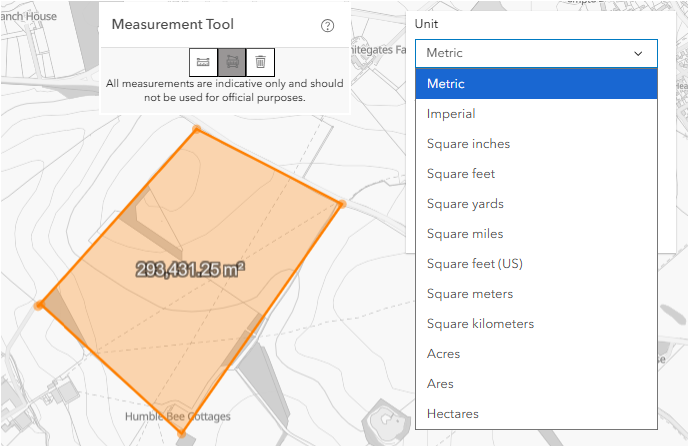
The default area and perimeter measurement is in Metric but you can change this by clicking the downwards facing arrow next to Metric. The other area measurement options are: Imperial, Square inches, Square feet, Square yards, Square miles, Square feet (US), Square meters, Square kilometers, Acres, Ares and Hectares.
If you have made a mistake or an incorrect measurement has been performed, there are 2 ways of clearing this.
1st - Reselect the measurement option i.e. Area & Perimeter or the Distance from within the pop up window.
2nd - Click the Clear measurements tool from the same pop up window. ![]()
Using the Print Tool
Please be aware of the following when using this tool:
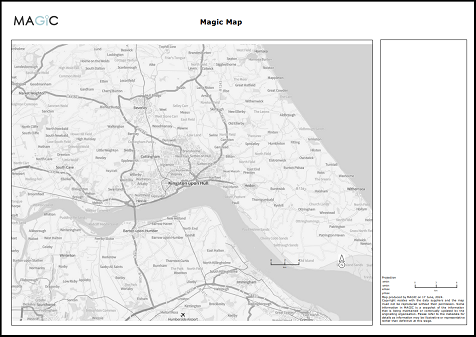
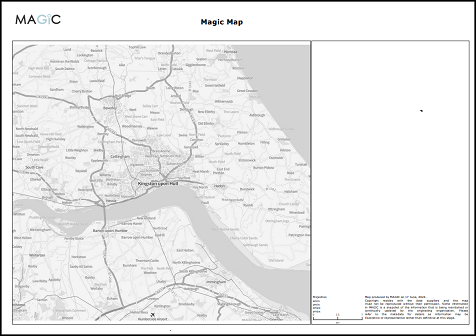
- Map printouts preserve the scale of the map, not the extent of the map window.
- As only scale is preserved, the map extent will be changed – the printed area will be either smaller or bigger compared to the area seen in the MAGIC interactive map window.
-
When printing, the centre of the map in the MAGIC interactive map window is placed in the centre of the print map frame. However please note the following:
- The Table of Contents (ToC) on the left hand side of the interactive map window actually appears over the top of the map when expanded.
- The centre of the map is therefore the centre of the map when the ToC is collapsed using the arrow which can be found at the bottom of the ToC.
- The map title, legend and margins in the print layouts take up some space too.
- The legend must be selected and visible in the ToC for the selected layers before it will print in the map printout legend.
- If you have a large number of layers selected, use one of the A3 large legend print layout options if you wish to see symbology appear in the legend for all the chosen layers.
- To preview your print – click the print button in the print menu
To print:
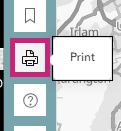
With your desired features selected from the ToC, select the Print button from within the Feature Tools list.
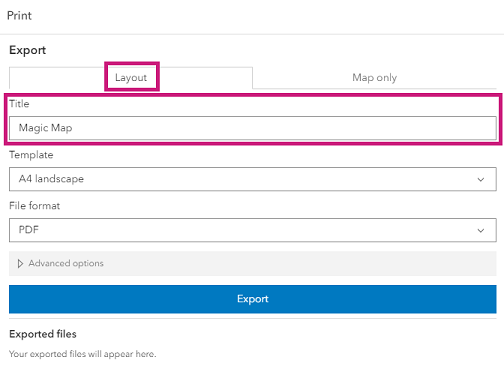
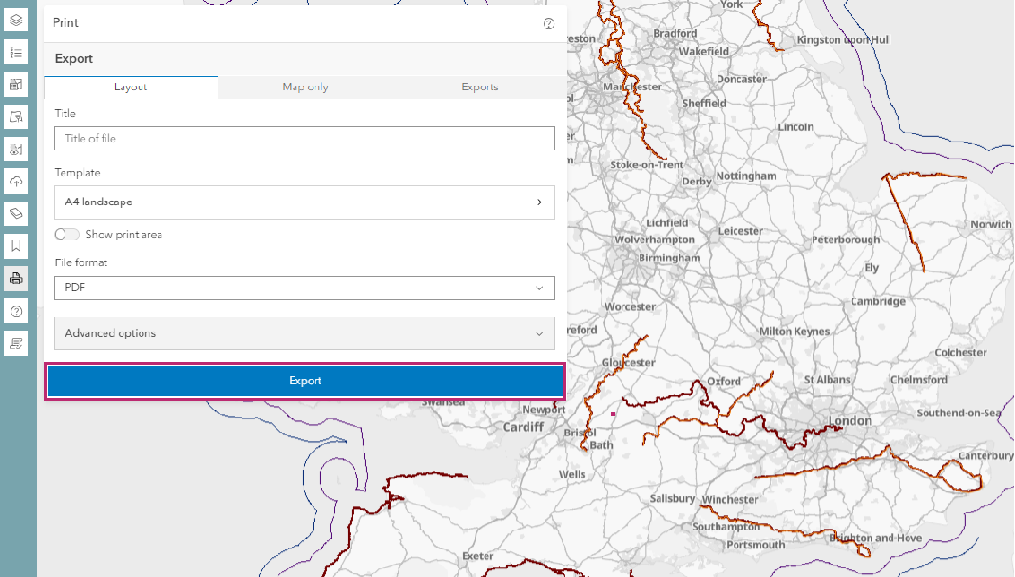
A new window appears which allows you to add a personalised name for the Map.
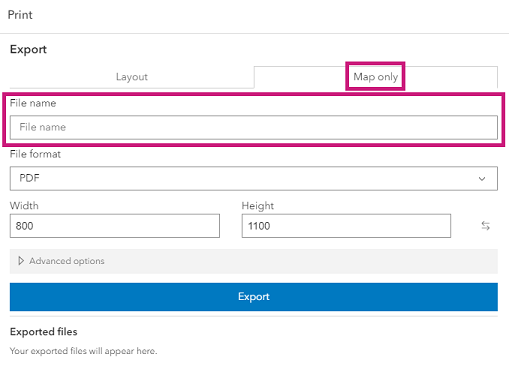
Map only title
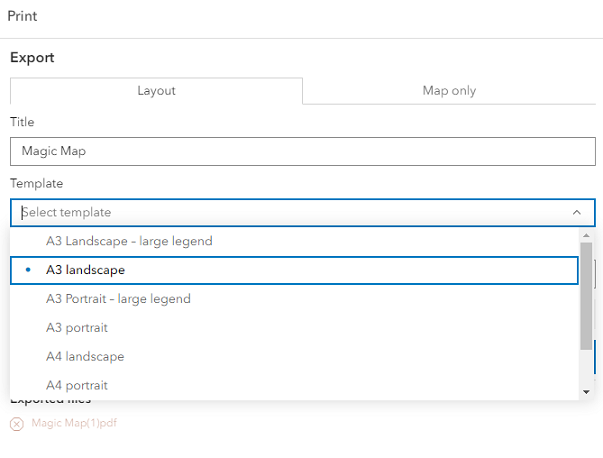
These are the print layout choices:
A3 Landscape
A3 Landscape Large Legend
A3 Portrait
A3 Portrait Large Legend
Map Only Landscape
A4 Landscape

Map Only Portrait
A4 Portrait
NB: use the Large Legend Options when you have so many layers selected that the key for all the layers will not fit on the normal layout.
Select your preferred print layout option.
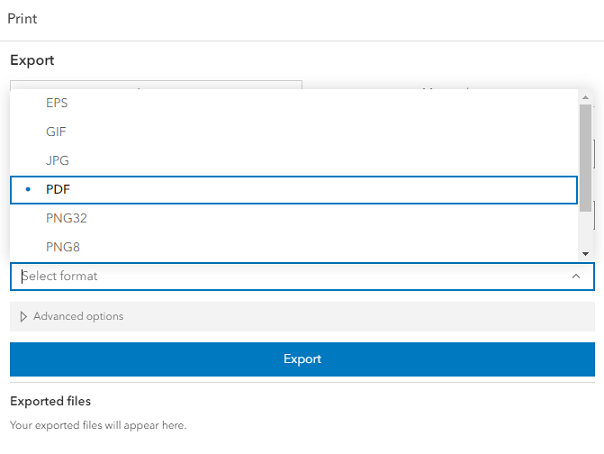
Select your preferred format.
Choose which Layout and Format best suits your requirements and then to keep the same extent as the map window in your printout check the 'Select this option to preserve Map extent' tickbox. You can then press the print button within the window.
NB: Once the Print button has been clicked, the application will take a moment to load (you will see a wheel spinning) and then the image for print will open in a new window.
Depending on the browser you are using will determine where the Print symbol is for example Chrome's print option will be top right of the screen, as shown in the above image.
Using the Bookmark Map Tool
To save time in the future you can bookmark a page which will allow you to revert to a pre-defined selection of features and scale.
To do this you need to have your desired features selected from the Table of Contents, scale & projection set.
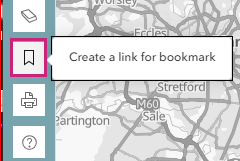
Now select the Bookmark page link from within the Feature Tools list
A pop up window appears and from here you will need to manually copy (Right click the mouse button & select copy or via the keyboard press Ctrl & C simultaneously) the link from within the box and paste it somewhere safe such as a word document.
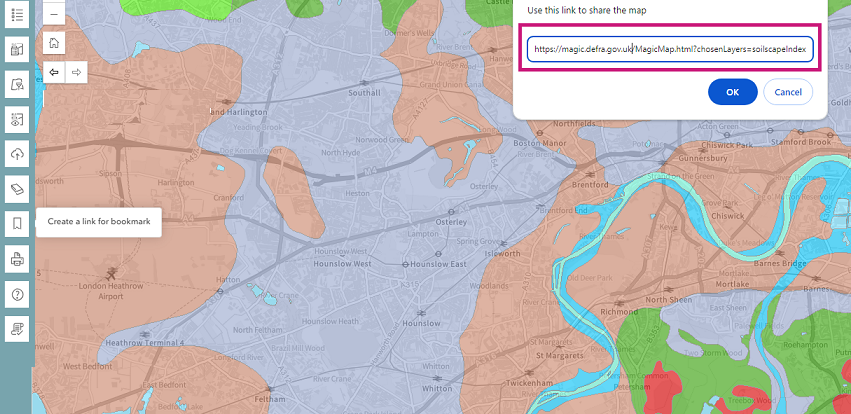
Once you have saved this, you can then paste the link into a browser of your choice and obtain the previous map view that had been chosen with all of the features present.
Using the Load User Data Tool
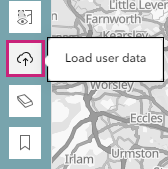
The Load Data Tool can be accessed by clicking on the Load User Data Tool
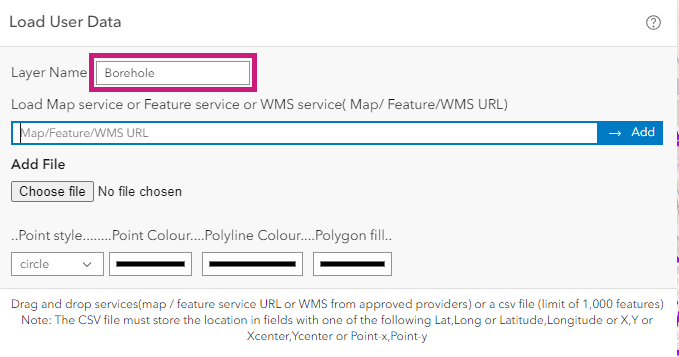
Data can be added in the following formats: Map service, Feature service, WMS service, Shape file in zip format, gpx and csv file.
Loading in Map / Feature / WMS URL
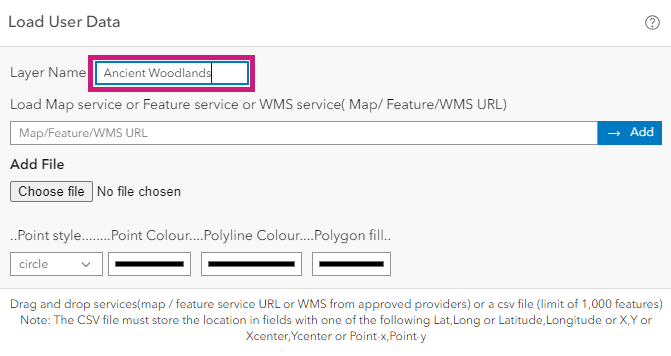
Enter a layer name in the text box.
Enter the URL into the Map / Feature / WMS URL text box. Click the Add Map/Feature/WMS Service button.
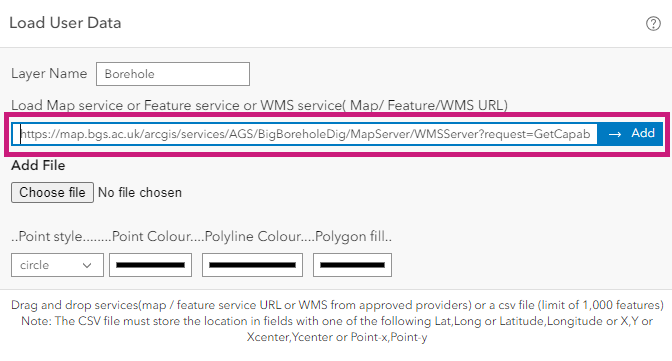
Note: any Map services, Feature services and WMS services added must be on an approved whitelist for security reasons.
Loading in a Shape file in zip format, gpx and csv file
Enter a layer name in the text box.
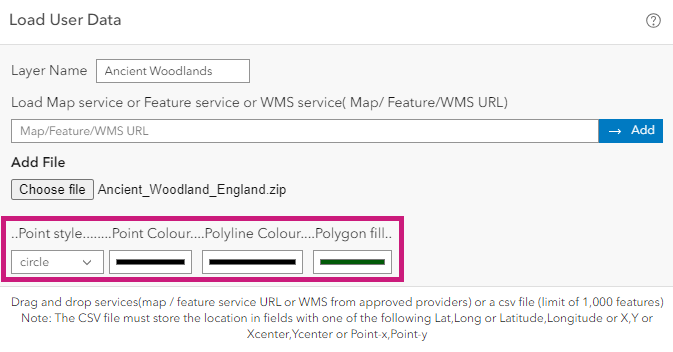
Select symbology and colour.
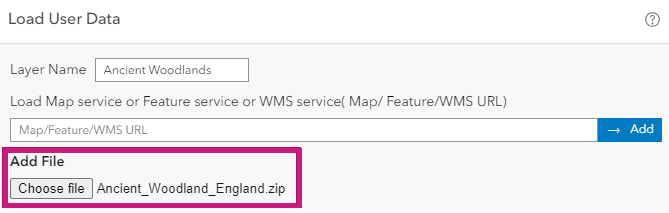
Click the Add File button to upload the file.
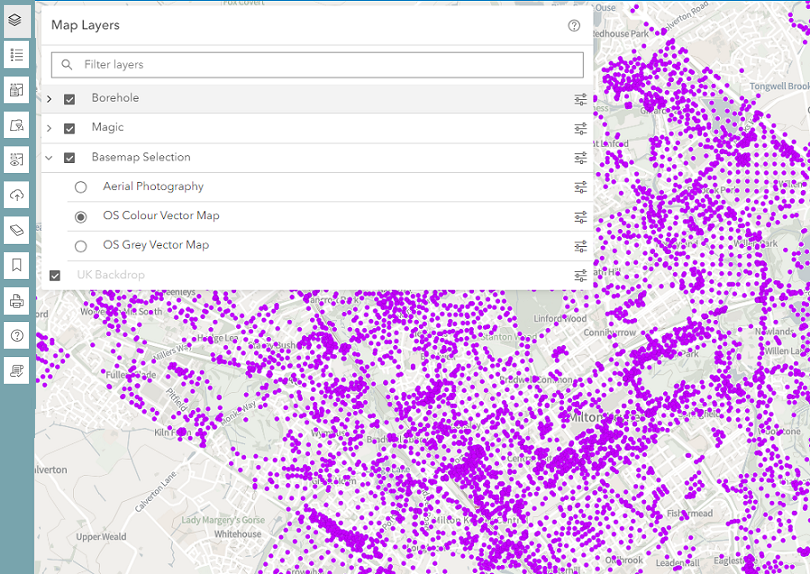
The data will be added to the map as a graphics file.
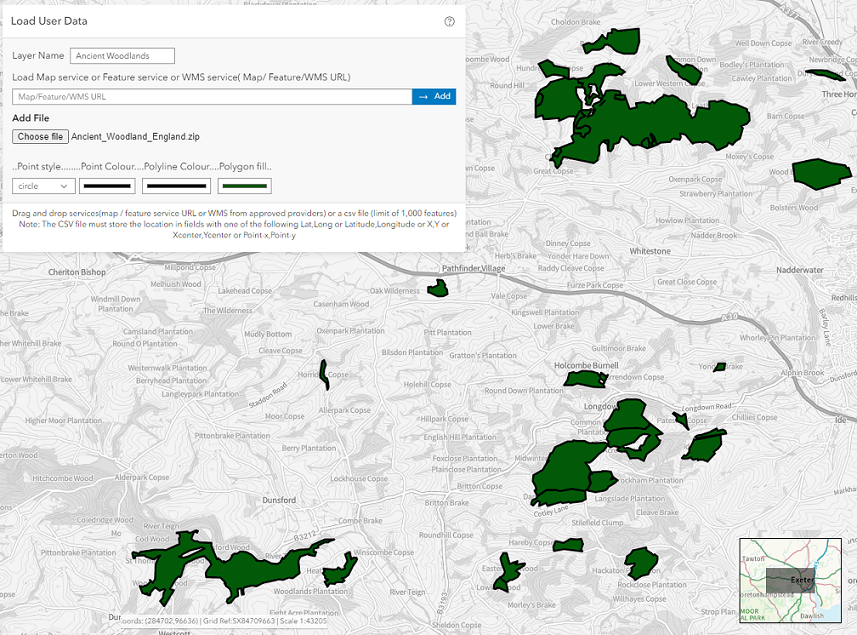
Using the data once it’s loaded
Data in shape, gpx and csv file format can be queried by clicking the left mouse button.
Using the Data Visibility Tool
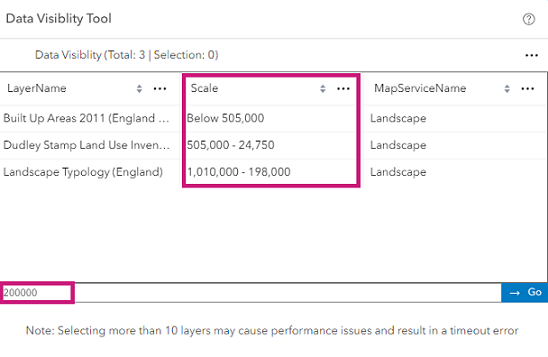
Select your chosen layers from the Table of Contents. Please note that selecting more than 10 layers may cause performance issues and result in a timeout error.
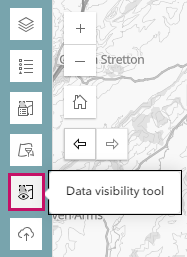
From the Feature Tools list click on the Data Visibility Tool.
The Data Visibility Tool will open with your selected layers. By checking the Scale column you can calculate at which scale all the layers will be visible. Insert the required scale into the Set Map Scale box and click on the Go button.
The map will zoom into the requested scale. Please be aware that not all selected layers may be located at the geographical area where the map zooms in. You may have to pan around the map to find the features of the selected layers. For example, if marine data is selected and the map zooms inland the layers will not be visible on the map. The map overview function highlighted below is a handy tool for quickly panning around the map.
Using the Legend Tool
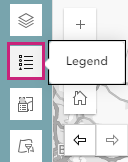
This tool is useful if you wish to see a legend only for your selected layers. From the Map Tools on the left select the Legend tool.
A Legend will appear with all the layers you have selected and which are visible at your chosen scale.
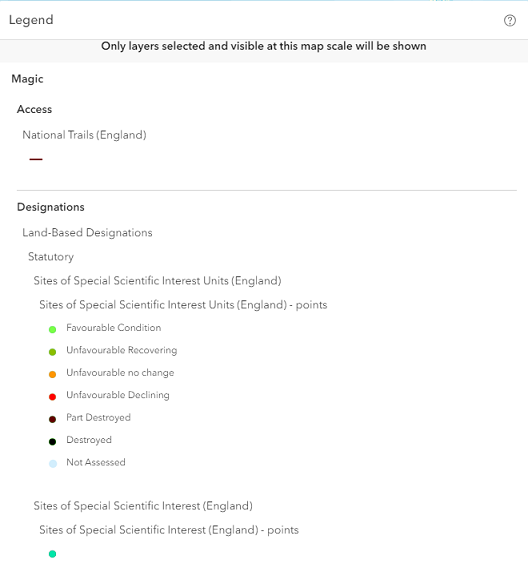
If you have selected a large number of layers you will need to use the scroll bar on the right hand side of window to see all the legend.
Using the Change Projection Tool
For more information regarding the different projections available, click here. To change the projection system that the map is displayed in, you can use the map projection selector in the top right corner of the map page.
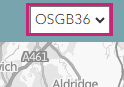
Click on the arrow and choose the projection you wish the map to be displayed in.
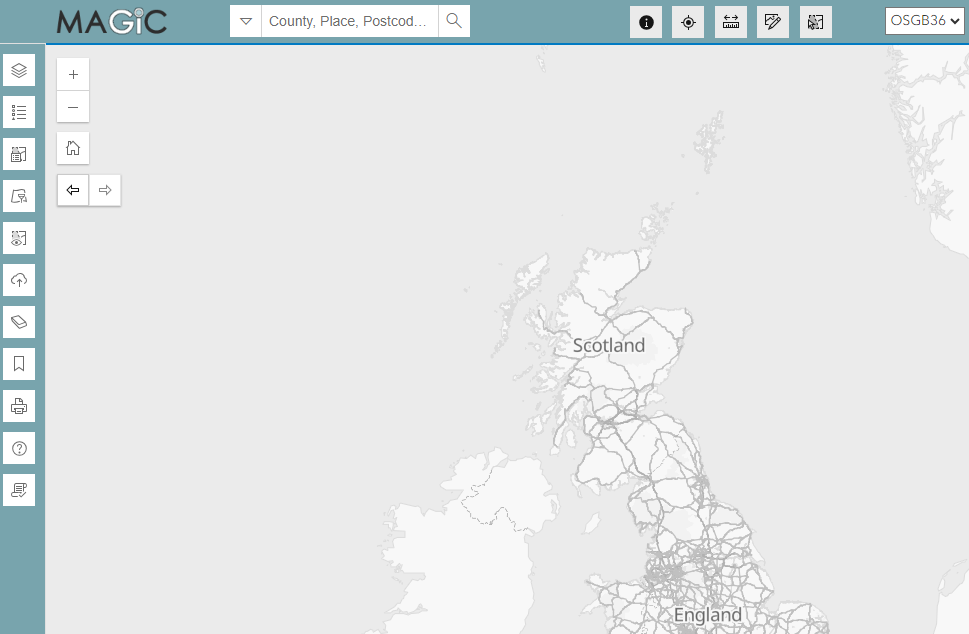
The OSGB36 projection is the default view and displays the Ocean Base map as standard.
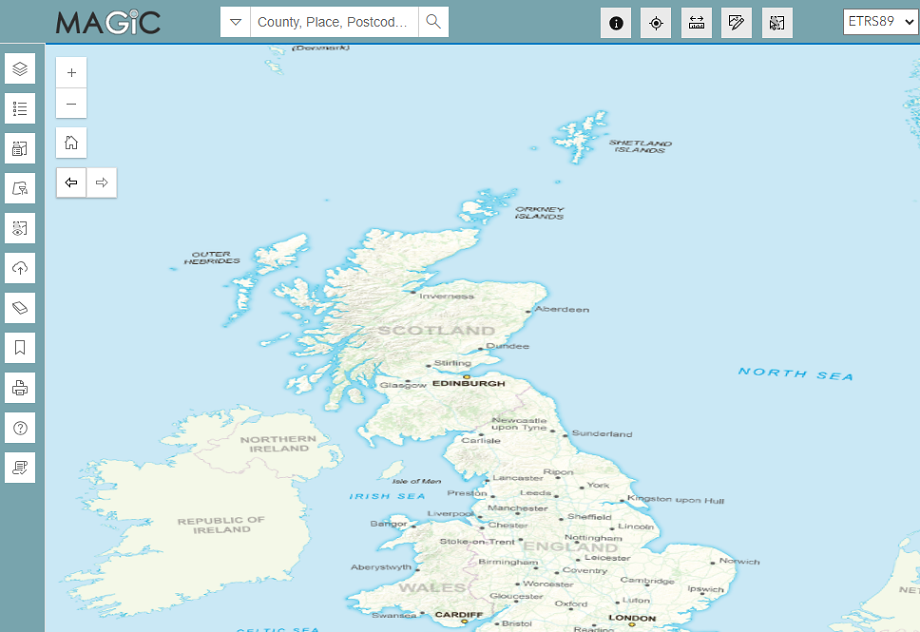
The ETRS89 Projection is useful for Marine Based data.
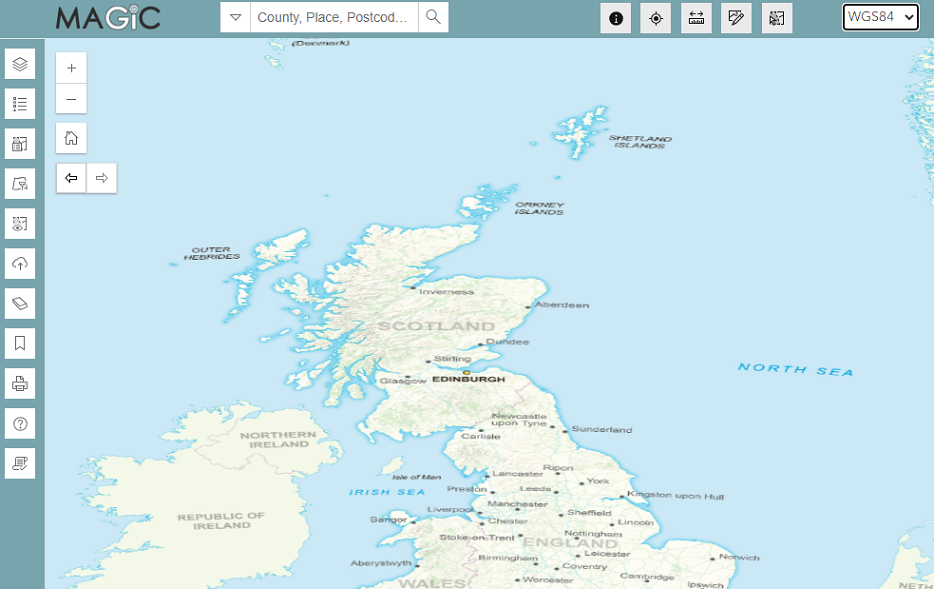
The WGS projection is also useful for Marine Data.